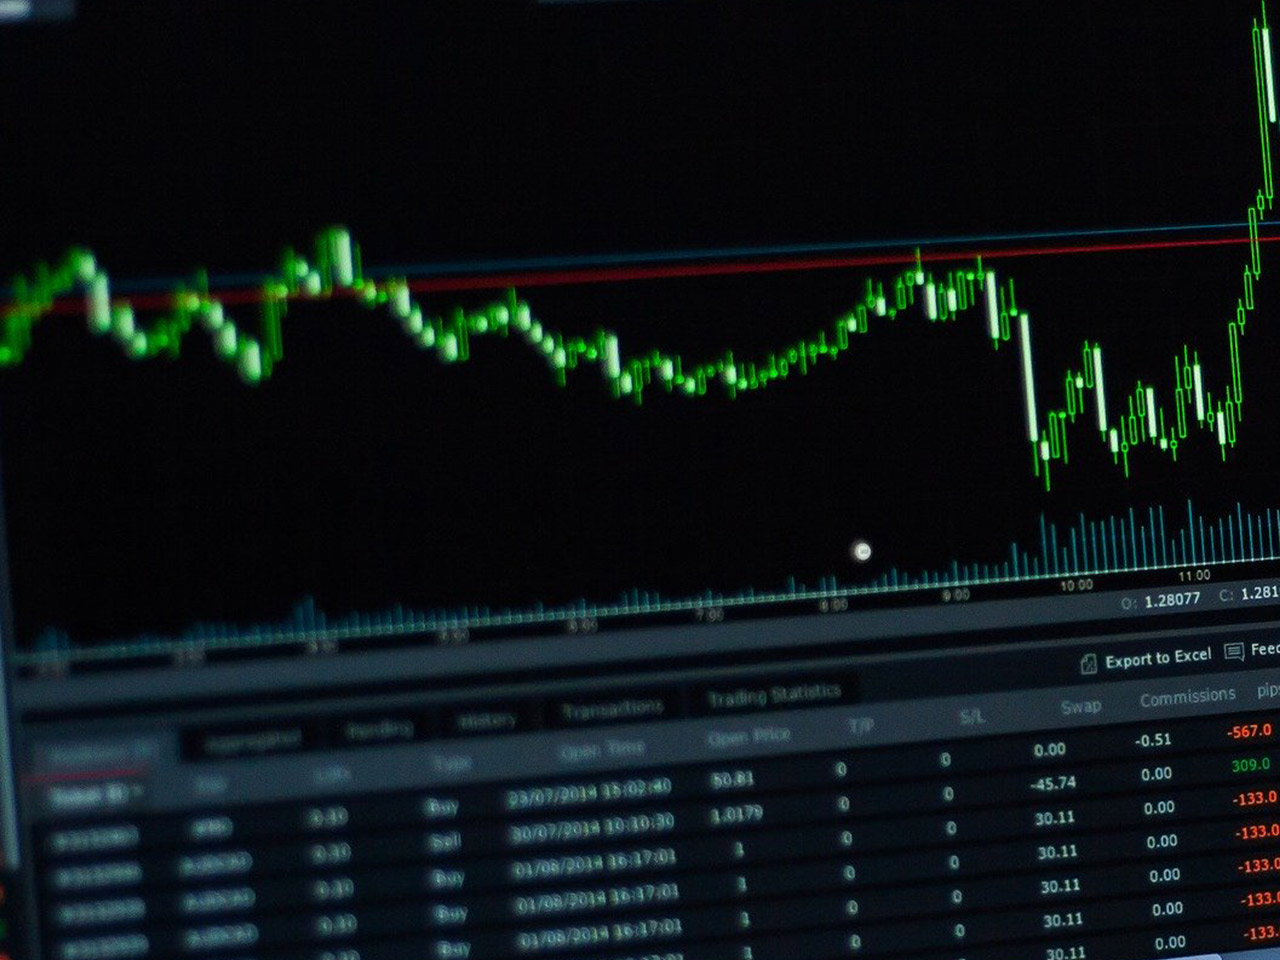
The stock price for Epwin Group ticker code: LON:EPWN has stepped up 3.74% or 2.62 points during today’s session so far. Market buyers have so far held a positive outlook while the stock has been in play. Range high for the period so far is 72.72 dipping to 71.82. Volume total for shares traded during this period was 16,769 with the average number of shares traded daily being 38,330. The 52 week high is 117.38 which comes in at 47.28 points in difference on the previous days close and a 52 week low being 58 a difference of some 12.1 points. Epwin Group now has a 20 SMA at 71.4 and a 50 day MA at 73.22. Market capitalisation for the company is £103.94m at the time of this report. Share price is traded in GBX. Mcap is measured in GBP. This article was written with the last trade for Epwin Group being recorded at Friday, July 10, 2020 at 11:48:57 AM GMT with the stock price trading at 72.72 GBX.
The trading price for Fresnillo ticker lookup code: LON:FRES has stepped up 2.81% or 26 points in today’s trading session so far. Traders have remained optimistic during the session. The periods high figure was 954.6 and a low of 910. The amount of shares exchanged has so far reached 397,952 with the average number of shares traded daily being 1,260,279. A 52 week high for the stock is 954.6 equating to 29 points in difference to the previous days close of business and a 52 week low sitting at 456.51 which is a variance of 469.09 points. Fresnillo now has a 20 moving average of 840.09 and now the 50 day moving average at 794.13. The current market capitalisation is £7,007.86m at the time of this report. The currency for this stock is GBX. Market cap is measured in GBP. This article was written with the last trade for Fresnillo being recorded at Friday, July 10, 2020 at 12:05:01 PM GMT with the stock price trading at 951.6 GBX.
Shares in J Sainsbury company symbol: LON:SBRY has increased 2.88% or 5.4 points during today’s session so far. Buyers have remained optimistic during the session. The periods high has already touched 192.95 meanwhile the session low reached 186.75. Volume total for shares traded during this period was 2,199,305 with the daily average at 14,944,137. The 52 week high for the share price is 236.7 equating to 49.3 points different to the previous business close and a 52 week low sitting at 171.19 a difference of some 16.21 points. J Sainsbury has a 20 day moving average of 203.06 and the 50 day simple moving average now at 197.98. This puts the market capitalisation now at £4,285.24m at the time of this report. Share price is traded in GBX. Mcap is measured in GBP. This article was written with the last trade for J Sainsbury being recorded at Friday, July 10, 2020 at 12:03:34 PM GMT with the stock price trading at 192.8 GBX.
The trading price for KEFI Minerals EPIC code: LON:KEFI has increased 3.56% or 0.05 points during today’s session so far. Buyers have remained positive during this period. The high for the period has peaked at 1.6 dropping as low as 1.4. The amount of shares exchanged has so far reached 49,081,669 with the daily average number around 21,616,984. The 52 week high price for the shares is 2.23 amounting to 0.82 points difference from the previous days close and putting the 52 week low at 0.51 a difference of some 0.9 points. KEFI Minerals now has a 20 moving average of 1.08 and also a 50 day simple moving average now of 1.05. Market capitalisation for the company is £27.07m at the time of this report. The stock is traded in GBX. Mcap is measured in GBP. This article was written with the last trade for KEFI Minerals being recorded at Friday, July 10, 2020 at 12:02:42 PM GMT with the stock price trading at 1.46 GBX.


