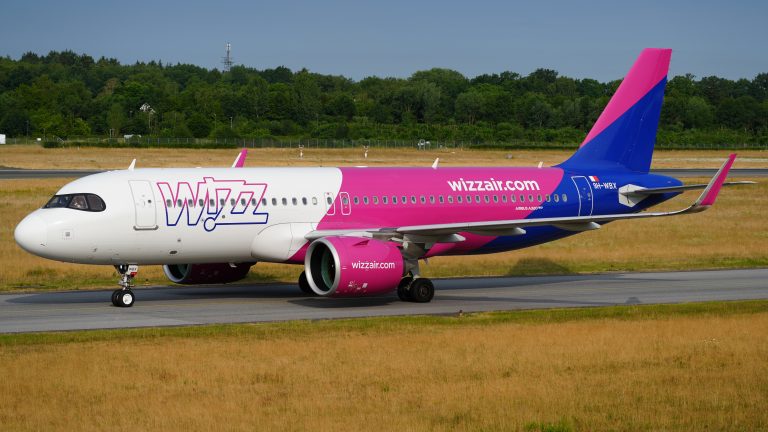
Wizz Air Holdings Plc (LON:WIZZ), one of the most sustainable and fastest-growing European airlines, has reported accelerated traffic growth and record-low emissions intensity for August 2025.
Wizz Air carried 6.91 million passengers during the month of August, an 11.4% increase year on year. Seat capacity increased 12.1% year on year, with a resilient load factor of 94.8%, down only -0.60 ppt on last year’s load factor of 95.4%, demonstrating continued strong demand.
During the month:
· Wizz Air continues to be one of the lowest emission airlines in August, reporting a further decline in CO2 emissions per RPK to 49.6 grams, down -2.5% year on year. This is only the second time in the last seven years that Wizz Air has delivered a number below 50 grams per RPK (Feb. 2023) and highlights the growing beneficial impact of its A321 neo deliveries, enhancing long-term cost discipline and sustainability leadership.
· While the last originating service from its to-be-closed Abu Dhabi base flew on August 31st, Wizz Air continues to rebuild its Tel Aviv station following the Summer suspension, with a full service of 24 routes to be deployed by mid-September. This underscores flexibility and resilience.
· On August 19th, Wizz Air announced a strategic distribution partnership with Travelfusion, the world’s largest flight content aggregator, which will help WIZZ better reach the 45% of travellers in Europe who still prefer to book through a retail channel (source: GBTA Business Travel Index Outlook report 2024), positioning Wizz Air for incremental revenue growth and expanded market reach.
| Month | Rolling 12 months | |||||||||
| August2025 | August2024 | Change YoY | August 2025 | August 2024 | Change YoY | |||||
| Capacity (seats) | 7,289,051 | 6,500,708 | 12.1% | 72,619,808 | 68,878,425 | 5.4% | ||||
| Passengers* | 6,911,275 | 6,203,673 | 11.4% | 66,145,937 | 62,070,578 | 6.6% | ||||
| Load Factor** | 94.8% | 95.4% | -0.6ppts | 91.1% | 90.1% | 1.0ppts | ||||
*Booked passengers
** Rounded to one decimal place
Wizz Air Monthly CO2 Emission Statistics*
| Month | Rolling 12 months | ||||||||
| August2025 | August2024 | Change YoY | August2025 | August 2024 | Change YoY | ||||
| CO2 (MT) Emissions | 566,493 | 536,186 | 5.7% | 5,924,127 | 5,747,231 | 3.1% | |||
| CO2 g per pax/km** | 49.6 | 50.9 | -2.5% | 51.5 | 52.5 | -2.0% | |||
* The published CO2 figures do not include any benefit from our SAF take-up
** Rounded to one decimal place


