Tesco Plc (LON:TSCO) has announced its Interim Results 2025/26.
CONTINUED INVESTMENT IN VALUE, QUALITY AND SERVICE, DRIVING STRONG MARKET SHARE GAINS.
| Performance highlights (on a continuing operations basis)1,2 | H1 25/26 | H1 24/25 | Change at actual rates | Change at constant rates |
| Group sales (exc. VAT, exc. fuel)2 | £33,051m | £31,463m | 5.1% | 5.1% |
| Group adjusted operating profit2 | £1,674m | £1,649m | 1.5% | 1.6% |
| Free cash flow2 | £1,298m | £1,261m | 2.9% | |
| Net debt3 | £(9,884)m | £(9,522)m | (3.8)% | |
| Adjusted diluted EPS2 | 15.43p | 14.45p | 6.8% | |
| Dividend per share | 4.80p | 4.25p | 12.9% | |
| Statutory measures (on a continuing operations basis)1 | ||||
| Revenue (exc. VAT, inc. fuel) | £36,036m | £34,773m | 3.6% | |
| Operating profit | £1,603m | £1,612m | (0.6)% | |
| Profit before tax | £1,305m | £1,392m | (6.3)% | |
| Diluted EPS | 14.22p | 14.62p | (2.7)% | |
| Statutory measures (including discontinued operations)1 | ||||
| Profit after tax | £950m | £1,051m | (9.6)% | |
| Diluted EPS | 14.22p | 15.03p | (5.4)% | |
Ken Murphy, Chief Executive:
“I am pleased with our first half performance, which builds on already strong momentum. Our market share gains in the UK are a particular highlight and reflect the decisive action we took at the start of the year to further invest in value, quality and service. The extension of our savings programme is helping offset new operating cost inflation, including increased National Insurance and other regulatory costs. Sales have grown across all our businesses, with customer satisfaction scores improving once again.
The steps we have taken to keep prices down for customers have improved our price position relative to the market. We have continued to enhance quality across all our ranges, including Finest, which is now in its third year of double-digit sales growth. Our summer ranges also benefited from over 470 new products and we continued to deliver market-leading availability. The opening of our new semi-automated distribution centre in Aylesford will further support our core fresh food offer.
We are also continuing to invest in our long-term growth, leveraging technology to drive more personalised engagement through Clubcard and deeper retail media reach across channels and suppliers. Our online business is going from strength-to-strength, enhanced by the recent launch of F&F online and continued growth in Whoosh, our rapid delivery service.
Competitive intensity remains high, and with continued pressure on household budgets, we remain committed to ensuring customers get the best possible value by shopping at Tesco. As we continue to invest, we are creating sustainable value for all our stakeholders. Our colleagues are central to everything we do, and I would like to thank them all for the role they have each played in delivering for our customers.”
Strong trading performance with operating profit growth and continued cash generation
| · | Group LFL4 sales up +4.3%, with growth across all markets: UK +4.9%, ROI +4.8%, Booker +1.7%, CE +3.4% | |
| · | Group adjusted operating profit2 up +1.6% at constant rates to £1,674m: | |
| · | UK & ROI up +2.1% to £1,468m with volume-driven market share gains, good weather and Save to Invest progress offsetting investment in our customer offer and operating cost inflation (incl. National Insurance increase and new packaging levy) | |
| · | Booker up +0.6% to £162m with a good weather tailwind and Save to Invest progress offsetting industry-wide operating cost pressures; Booker is now reported as a separate operating segment (see page 4) | |
| · | Central Europe down (11.2)% to £44m reflecting targeted price investments to counter competitive pressures as well as lower rental income following the sale of mall properties in H2 24/25 | |
| · | Adjusted diluted EPS2 up +6.8% to 15.43p, driven by higher Group adjusted operating profit and the benefit of our ongoing share buyback programme | |
| · | Statutory operating profit of £1,603m, down (0.6)% reflecting restructuring and Bank separation adjusting items; statutory diluted EPS of 14.22p, down (2.7)%, which also reflects non-cash fair value remeasurements of financial instruments | |
| · | Free cash flow2 of £1,298m, up +2.9%, reflecting working capital inflows due to strong sales, and continued capital discipline | |
| · | Net debt3 at £(9,884)m versus £(9,454)m at year end which included the full proceeds from the disposal of the Group’s Banking operations, which have been partially returned in the half; Net debt/EBITDA stable at 2.0 times | |
| Footnotes can be found at the bottom of page 4. | ||
Increasing customer satisfaction contributing to further UK market share gains
| · | UK market share up +77bps YoY to 28.4%, having now gained share for 28 consecutive four-week periods; ROI up +11bps YoY at 23.7%, consolidating three years of consistent market share gains |
| · | Overall brand perception up +96bps YoY; with continued gains in satisfaction (+263bps), value (+89bps) and quality (+13bps); outperforming the competitor average on all six measures as tracked by YouGov |
| · | Improved price position against the market, notably on the products most frequently purchased by customers |
| · | Delivered market-leading availability and highest net promoter score in six years |
| · | Awarded first place in the Advantage supplier survey for tenth year; overall supplier satisfaction of 88%, up +1ppt YoY |
| · | Introduced additional financial incentives totalling c.£10m for over 400 UK farmers across our sustainable farming groups to achieve environmental and animal welfare goals |
| · | Insurance and Money Services adjusted operating profit of £100m, up £6m YoY, with new partnership income and strong cost control helping to offset £42m of non-recurring benefits recognised in the prior year |
Continued range innovation with investments in distribution capacity and new AI capabilities
| · | Over 470 new products launched and a further 560 products improved across our own-brand ranges; Finest sales up +16%, with over 300 new and improved products |
| · | Opened new semi-automated fresh food distribution centre in Aylesford; signed agreement to develop a new distribution centre at DP World London Gateway, which we expect to open in 2029 |
| · | Continued development of AI capability across our business, including improvements to in-house tools which find the most efficient journey for every Tesco lorry and delivery van, removing around 100,000 miles per week |
Expanding the reach and breadth of our market leading online offer
| · | UK online sales up +11.4%, driven by growth in orders per week, with market share up +112bps YoY to 36.9%; ROI online sales up +18.8%, supported by the launch of same day delivery last year |
| · | Tesco Whoosh rapid delivery service sales up +59%, with further growth in active customers and basket sizes, and the service now covering over 70% of UK households; Tesco Whoosh recently launched in ROI |
| · | Further build-out of digital ecosystem with recent launch of F&F online, helping more customers access our enhanced range of stylish and affordable clothing, complementing Tesco Marketplace |
Enhancing personalised engagement through Clubcard and expanding the Tesco Media and Insight platform
| · | Over 13m customers are now receiving even more timely and relevant offers, product recommendations and recipe ideas, supported by our new partnership with Adobe |
| · | Targeted digital coupons offered to 10m customers; continuing trial of Your Clubcard Prices |
| · | Growth in advertisers using Tesco Media and Insight Platform; particularly significant growth for smaller advertisers who are building their brands through tailored product offerings; over 1,400 screens added to stores and One Stop trial underway |
| · | Retail media product launches included video advertising on the Tesco app and Express store wraps; shortlisted for eight MediaWeek awards and winner of ‘Retail Media Network of the Year’ at Retail MediaX Awards |
CAPITAL RETURN PROGRAMME.
Since the commencement of our £1.45bn share buyback programme on 10 April 2025 and up until market close on 1 October 2025, we have bought back £891m worth of our ordinary shares. The balance will be completed by April 2026. Since launching our programme in October 2021, we have bought back a total of £3.7bn worth of ordinary shares.
OUTLOOK.
In April, we noted an increase in the competitive intensity of the UK market and provided guidance that allowed us to take decisive action and invest in every aspect of our customer shopping trip.
Competitive intensity remains elevated. However, in the first half, a better-than-expected customer response to our actions and the benefit of an extended period of good weather have helped offset the cost of our investments.
We are committed to doing everything we can to keep prices down and deliver great quality, service and availability for our customers, and are making good progress towards our c.£500m Save to Invest target, helping to mitigate the impact of increased cost inflation.
We now expect FY 25/26 Group adjusted operating profit between £2.9bn and £3.1bn, an increase from the previous range of between £2.7bn and £3.0bn. We continue to expect free cash flow within our medium-term guidance range of £1.4bn to £1.8bn.
FY 25/26 is a 53-week financial year, but for comparability we will also report our key financial metrics on a 52-week basis. All financial guidance is provided on a 52-week basis.
STRATEGIC PRIORITIES.
Our strategic priorities ensure that we focus on offering great value, quality and convenience whilst rewarding loyalty. Through our colleagues, reach and supplier relationships, we are well-placed to serve our customers wherever, whenever and however they need us. Our strategy puts customers at the heart of everything we do, and guides us to deliver top-line growth, grow profit and generate cash and, in doing so, deliver for all our stakeholders.
1) Magnetic Value for Customers – Re-defining value to become the customer’s favourite
| · | Providing great value to customers through Aldi Price Match on >600 lines, Low Everyday Prices on c.1,000 lines and c.10,000 Clubcard Prices deals each week; Clubcard Prices save customers up to £375 off their annual grocery bill |
| · | In the UK, we have reduced the price of 6,500 products year-on-year, with an average reduction of around 9% |
| · | ‘That’s True Value’ campaign inspiring customers with recipe tips and helping them better manage the cost of a weekly shop |
| · | Summer ranges benefited from product innovations including a new and improved sushi offering, enhanced Finest BBQ range and exciting launches such as Finest Gelato and iced coffee concentrates; won Free From ‘Retailer of the Year’ 2025 |
| · | Supporting customers to make healthy choices through new five-a-day fruit and vegetable campaign, with c.2.5m customers invited to earn personalised rewards; expanded Stronger Starts Fruit & Veg programme to 500 schools |
| · | Booker customer satisfaction increased year-on-year, with over 600 prices locked over the summer and new catering ranges launched with support from our Group product development teams |
| · | Central Europe NPS improvements across all three countries as customers responded well to our price investments |
| · | Tesco Mobile named ‘Best Mobile Network for Customer Service’ at USwitch Telecoms Awards for a fourth consecutive year |
2) I Love my Tesco Clubcard – Creating a competitive advantage through our powerful digital capability
| · | Clubcard penetration remains high in all markets: UK 84%, ROI 87%, Central Europe 87%, with over 24m Clubcard households in the UK; increase in Reward Partner customer awareness and satisfaction |
| · | Clubcard Challenges now in its tenth round, with growing customer and supplier engagement |
| · | Trialling use of Clubcard analytics to anticipate and remind customers when they may be running low on household products |
| · | Celebrating 30 Years of Clubcard with exclusive offers, including £100 gift cards with selected Tesco Mobile deals and cinema tickets for just £2.50 in Clubcard vouchers |
| · | New partnership with Pod, enabling customers to collect Clubcard points on EV charging at Tesco stores |
3) Easily the Most Convenient – Serving customers wherever, whenever and however they want to be served
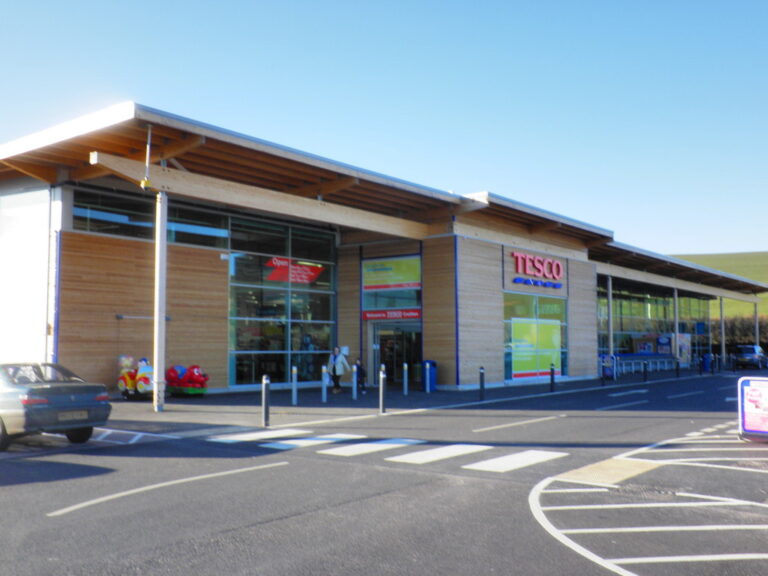
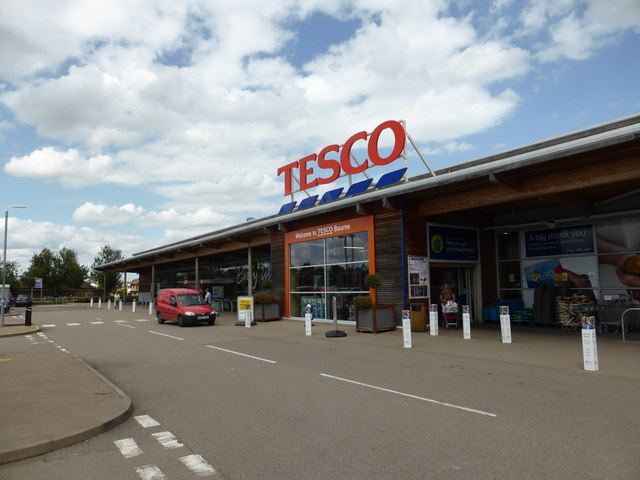
| · | Opened 38 stores across the Group including 5 large stores and 33 convenience stores: 32 total store openings in the UK, 3 in ROI and 3 in Central Europe |
| · | Expansion in UK grocery home shopping capacity including over 130 new delivery vans; Delivery Saver subscribers at 788k, up +9.3% year-on-year |
| · | Tesco Whoosh expanded to over 1,600 stores across the UK including over 180 large stores giving customers access to an even wider range of products; over 600,000 products now available on Tesco Marketplace |
| · | Tesco app and Scan as you Shop devices now able to provide customers with live stock levels, highlight in-store offers and help them navigate their shopping list in aisle order |
| · | Grew our online reach in Central Europe, with sales up +19.1%; service rolled out to nine more stores |
| · | Added 275 net new retail partners across Booker’s symbol brands of Premier, Londis, Budgens and Family Shopper |
4) Save to Invest – Significant opportunities to simplify, become more productive and reduce costs
| · | On track to deliver c.£500m Save to Invest target for FY 25/26, helping offset new cost inflation, including increased National Insurance contributions (FY c.£235m) and the new Extended Producer Responsibility (EPR) packaging levy (FY c.£90m) |
| · | Continued progress across all areas, including goods & services not for resale, operations, property and central overheads |
| · | Further rollout of convertible tills that can be used by colleagues or for self-service, giving greater flexibility |
| · | Optimising in-store routines in Express stores by better aligning delivery schedules with staffing levels |
| · | Re-configuring store catchments for grocery home shopping allowing for a higher number of deliveries per hour |
| · | Remote monitoring of store equipment including refrigeration to identify early maintenance opportunities to improve reliability and reduce energy costs |
GROUP REVIEW OF PERFORMANCE.
On a continuing operations basis1
| 26 weeks ended 23 August 20252 | H1 25/26 | H1 24/25 | Change at actual rates | Change at constant rates |
| Sales (exc. VAT, exc. fuel)2 | £33,051m | £31,463m | 5.1% | 5.1% |
| Fuel | £2,985m | £3,310m | (9.8)% | (9.8)% |
| Revenue (exc. VAT, inc. fuel) | £36,036m | £34,773m | 3.6% | 3.7% |
| Group adjusted operating profit2 | £1,674m | £1,649m | 1.5% | 1.6% |
| Adjusting items | £(71)m | £(37)m | ||
| Statutory operating profit | £1,603m | £1,612m | (0.6)% | |
| Net finance costs | £(297)m | £(218)m | ||
| Joint ventures and associates | £(1)m | £(2)m | ||
| Statutory profit before tax | £1,305m | £1,392m | (6.3)% | |
| Taxation | £(355)m | £(370)m | ||
| Statutory profit after tax | £950m | £1,022m | (7.0)% | |
| Adjusted diluted EPS2 | 15.43p | 14.45p | 6.8% | |
| Statutory diluted EPS | 14.22p | 14.62p | (2.7)% | |
| Interim dividend per share | 4.80p | 4.25p | 12.9% | |
| Net debt3 | £(9,884)m | £(9,522)m | (3.8)% | |
| Free cash flow2 | £1,298m | £1,261m | 2.9% | |
| Capex5 | £667m | £530m | 25.8% |
Sales2 increased by 5.1% at constant rates, with growth across all operating segments. Group sales volumes continued to grow, supported by further investments in the customer offer, particularly in response to an increase in competitive intensity in the UK. Revenue increased by 3.7% at constant rates, including a (9.8)% decline in fuel sales, primarily driven by lower fuel retail prices year-on-year.
Group adjusted operating profit2 increased by 1.6% at constant rates, with the growth in sales volumes and our Save to Invest programme offsetting operating cost inflation and allowing us to put even more investment in our customer offer across value, quality and service. Insurance and Money Services performed well, driven by income from the new partnership with Barclays and strong cost control. Group adjusted operating profit margin was down (10)bps reflecting investments in the customer offer.
Statutory operating profit decreased by (0.6)% year-on-year, as the growth in adjusted operating profit was offset by an increase in restructuring and property adjusting items, including the fair value remeasurement of certain residential properties transferred to assets held for sale, and separation costs related to the disposal of the Group’s Banking operations. The prior year included adjusting income relating to gains on disposal of surplus properties.
Net finance costs increased by £(79)m year-on-year, largely due to mark-to-market movements on certain derivative financial instruments, with adjusted net finance costs broadly flat year-on-year. The reduced tax charge reflects the decrease in statutory profits, driven by adjusting items.
Adjusted diluted EPS2 grew by 6.8%, driven by higher adjusted operating profit and the continued benefit from a reduction in share count due to our ongoing share buyback programme. We have announced an interim dividend of 4.80 pence per ordinary share, in line with our policy to pay 35% of the prior full-year dividend.
We generated £1,298m of free cash flow2, including a £408m working capital inflow. Net debt, which at year end included c.£700m from the sale of the Group’s Banking operations, increased by £(430)m, reflecting the progress made during the first half in returning the proceeds through share buybacks. The net debt/EBITDA ratio was 2.0 times at the end of the first half.
Further commentary on these metrics can be found below and a full income statement can be found on page 15.
Operating segment presentation – UK & ROI and Booker
Following changes to the Group Executive Committee during the period, Booker, which was previously reported as part of the UK & ROI operating segment, now meets the definition of an operating segment in its own right, as set out in IFRS 8 ‘Operating Segments’. These results are therefore presented on this basis. For comparative purposes and on an equivalent basis, FY 24/25 UK & ROI adjusted operating profit was £2,726m and Booker adjusted operating profit was £290m. There have been no other changes to operating segments since the year end. Further details are included in Note 2 on page 21.
Footnotes:
1. In line with FY 24/25, the performance of the Banking operations in the prior year is presented as a discontinued operation. The Insurance and Money Services business (IMS) is presented on a continuing operations basis and therefore within the headline performance measures. There are no discontinued operations in the current period.
2. The Group has defined and outlined the purpose of its alternative performance measures, including its performance highlights, in the Glossary starting on page 38.
3. Net debt includes Insurance and Money Services, with the prior year reported on a consistent basis. The impact on H1 24/25 is to reduce Net debt by £154m. Further information on Net debt can be found in Note 19, starting on page 35.
4. Like-for-like (LFL) sales growth is a measure of growth in Group sales from stores that have been open for at least a year and online sales (at constant exchange rates, excluding VAT and fuel). LFL excludes revenue from dunnhumby, Insurance and Money Services and mall rental income as this revenue is not directly linked to the sale of goods.
5. Capex excludes additions arising from business combinations, property buybacks (typically stores) and other store purchases and their associated refit costs. Refer to page 43 for further details.
Segmental review of performance:
Sales performance:
(exc. VAT, exc. fuel)2,4
| On a continuing operations basis1 | Sales (£m) | LFL sales change4 | Total sales change at actual rates | Total sales change at constant rates |
| – UK | 24,670 | 4.9% | 5.6% | 5.6% |
| – ROI | 1,541 | 4.8% | 6.4% | 6.5% |
| UK & ROI | 26,211 | 4.9% | 5.6% | 5.6% |
| Booker | 4,734 | 1.7% | 2.4% | 2.4% |
| Central Europe | 2,106 | 3.4% | 4.4% | 5.0% |
| Sales | 33,051 | 4.3% | 5.1% | 5.1% |
Further information on sales performance is included in the appendices starting on page 47.
Adjusted operating profit2 performance:
| Profit (£m) | |||||
| On a continuing operations basis1 | Change at actual rates | Change at constant rates | Margin % at actual rates | Margin % change at actual rates | |
| UK & ROI | 1,468 | 2.0% | 2.1% | 5.0% | (9) bps |
| Booker | 162 | 0.6% | 0.6% | 3.4% | (6) bps |
| Central Europe | 44 | (10.0)% | (11.2)% | 2.0% | (30) bps |
| Group | 1,674 | 1.5% | 1.6% | 4.6% | (10) bps |
Further information on operating profit performance is included in Note 2 starting on page 21.
UK & ROI OVERVIEW:
In the UK & ROI, like-for-like sales increased by 4.9%. We continued to deliver volume growth in both markets, with continued market share and switching gains in the UK in the half, and ROI gaining share year-on-year consolidating three years of market share outperformance. The strong performance in the UK reflects a positive reaction to our targeted price investments in response to increased competitive intensity, with both markets also benefiting from warmer weather.
UK & ROI adjusted operating profit was £1,468m, up 2.1% at constant rates. Profit growth in the segment was driven by the strong trading performance and ongoing Save to Invest delivery more than offsetting investments in the customer offer and ongoing cost inflation, including increased National Insurance contributions and the new Extended Producer Responsibility (EPR) levy. Insurance and Money Services adjusted operating profit increased from £94m to £100m reflecting income from the new partnership with Barclays, which together with strong cost control, helped to offset £42m of non-recurring benefits recognised in the prior year.
UK – A continued focus on value, quality and service driving further volume and market share growth:
Like-for-like sales grew 4.9%, with growth across all channels. Overall market share grew by +77bps year-on-year to 28.4%, with market outperformance across large, convenience and online. We have now delivered 28 consecutive four-week periods of market share gains and 31 consecutive four-week periods of switching gains. Overall brand perception outperformed the market, with strong year-on-year growth in satisfaction (+263bps) and value (+89bps), and a further improvement in quality (+13bps).
Food like-for-like sales grew by 5.7%, with a strong volume performance from fresh food, driven by ongoing range development, focused on product quality and innovation. We launched over 470 new products and improved a further 560. Finest sales continued to grow strongly, with sales up 16% year-on-year and 33% over two years.
We remain committed to ensuring customers get the best value for money by shopping at Tesco and have maintained our strong price positioning relative to the market, reducing the price of over 6,500 products versus last year, with an average reduction of around 9%.
Clothing saw strong like-for-like sales growth of 7.8%, as customers responded well to our Spring / Summer ranges, particularly in womenswear and childrenswear, with volumes also supported by good weather. The recent launch of F&F online has allowed more of our customers to access a much fuller range of clothing and complements our broader Tesco Marketplace proposition which now includes over 600,000 products.
Home like-for-like sales declined by (2.1)%, which includes a (5.2)ppts drag from the transition to our partnership with The Entertainer, which completed in the second half last year. The partnership, which offers customers an even better range of toys in our stores, means we no longer recognise toy sales, and instead earn commission income. Excluding this impact, Home like-for-like sales grew by 3.1% with the F&F home lifestyle range continuing to perform strongly post-launch in the second half of last year.
Like-for-like sales grew across both our large and convenience store formats with our net promoter score showing improvement in the half across all measures, with the greatest improvement across reputation and quality. Large store like-for-like sales grew by 4.5%, as we maintained our market-leading availability and customers responded well to our investments in the customer offer and shopping experience. Convenience like-for-like sales, which include sales from our One Stop stores, grew by 1.4%. Within this, Tesco Express like-for-like sales were up 1.8%, including a particularly strong performance in fresh food volumes.
Online sales grew by 11.4%, driven primarily by volume growth, including a c.2ppts contribution from Tesco Whoosh, our rapid delivery service. Overall average orders per week grew 12.1% year-on-year as we introduced over 70,000 additional weekly delivery slots and rolled out further improvements to our website and substitution algorithms. The number of Delivery Saver subscribers increased by 9.3% to 788,000. Tesco Whoosh generated double-digit growth, with growth across both basket sizes and number of active customers.
| Online performance | H1 25/26 | YoY change |
| Sales inc. VAT | £3.7bn | 11.4% |
| Orders per week | 1.45m | 12.1% |
| Basket size (excluding Whoosh, Marketplace and F&F online) | £111 | 2.8% |
| Online % of UK total sales | 14.0% | 0.7ppts |
ROI – New store openings complement like-for-like volume growth, driven by Food:
Like-for-like sales grew by 4.8%, with volume growth driven by the continued roll out of our ‘fresh first’ store refresh programme and helped by warmer weather year-on-year. Total sales grew by 6.5% at constant rates, including a 1.3ppt contribution from three new stores in the half and the full year effect of prior year store openings.
Food like-for-like sales grew by 5.1%, with fresh food like-for-like sales up 6.3% as we continued to invest in product quality and innovation across the range. These investments helped support a five-point improvement in our net promoter score, with quality perception up +3ppts year-on-year.
Like-for-like sales grew across all channels. Online sales performed strongly with growth of 18.8%, supported by the launch of same day delivery last year.
Non-food like-for-like sales declined by (1.8)%, which includes a (3.8)ppts impact from the transition to the partnership with The Entertainer. Excluding toys, non-food sales grew by 2.0% supported by volume growth in clothing.
Overall market share grew by +11bps year-on-year to 23.7%, consolidating three years of consistent market share gains.
BOOKER OVERVIEW – Strong growth across core retail and catering offsetting ongoing tobacco industry decline:
Sales   LFL
£m
Core retail 1,725 4.10%
Core catering* 1,461 5.70%
Tobacco 810 -8.80%
Best Food Logistics 738 1.30%
Total Booker 4,734 1.70%
*Includes sales to small businesses and sales from Venus Wine and Spirit Merchants PLC, which was acquired in June 2024 and is included in LFL growth from June 2025.
Overall like-for-like sales grew by 1.7%, with strong growth in core retail and catering offset by the continuing decline in the tobacco market. Best Food Logistics grew by 1.3% despite ongoing weakness in parts of the fast-food market it serves.
Core retail like-for-like sales increased by 4.1% year-on-year, driven by a strong growth in our symbol brands (Premier, Londis, Budgens and Family Shopper), with a further 275 net new retail partners acquired in the half. Booker retail customer satisfaction levels continued to improve, with gains year-on-year.
Core catering like-for-like sales increased by 5.7%, with volume growth supported by good weather. We continue to be competitive on price and have seen continued improvements in customer satisfaction levels, with gains year-on-year.
We continue to make good progress in integrating Venus, a specialist wine and spirit merchant which we acquired in June last year, extending its coverage with the addition of new fulfilment space within our network.
Booker delivered adjusted operating profit of £162m, up +0.6% year-on-year. A strong trading performance across core retail and catering, supported by favourable weather and savings generated through our Save to Invest programme, helped to offset significant operating cost inflation, including the new EPR levy.
CENTRAL EUROPE OVERVIEW – Sales growth amid challenging regulatory and competitive pressures:
Like-for-like sales grew by 3.4%, with growth across all countries. Food like-for-like sales grew by 4.0% year-on-year, with fresh food like-for-like sales up 7.0%. Our targeted price investments have enabled us to remain competitive across all markets and contributed to an improvement in our customer net promoter scores.
Non-food like-for-like sales were down (0.8)%, impacted by subdued consumer confidence and poor weather, with volumes lower across both home and clothing.
Central Europe adjusted operating profit was £44m, a decrease of £(5)m year-on-year. The decline reflects a reduction in mall income following the sale of mall properties in H2 24/25, increased competition, particularly in Slovakia, and ongoing regulatory pressure. This has been partially offset by the ongoing success of our Save to Invest initiatives.
Adjusting items:
| H1 25/26 £m | H1 24/25 £m | |
| Amortisation of acquired intangible assets | (38) | (38) |
| Separation costs related to disposal of Banking operations | (13) | (3) |
| Restructuring and property (costs) / income | (20) | 4 |
| Total adjusting items included within operating profit | (71) | (37) |
| Net finance (costs) / income | (34) | 51 |
| Tax credit / (charge) | 24 | (2) |
| Total adjusting items included within profit after tax from continuing operations | (81) | 12 |
| Adjusting items included within discontinued operations | – | (41) |
| Total adjusting items including discontinued operations | (81) | (29) |
Adjusting items are excluded from our adjusted operating profit performance by virtue of their size and nature, to provide a helpful perspective of the year-on-year performance of our ongoing business. Total adjusting items in statutory operating profit from continuing operations resulted in a net charge of £(71)m, compared to a net charge of £(37)m in the prior period.
We continue to present amortisation of acquired intangible assets, principally relating to the merger with Booker, as an adjusting item. The amortisation of acquired intangible assets was £(38)m, in line with the prior year.
We incurred £(13)m (H1 24/25: £(3)m) in separation costs relating to the disposal of our Banking operations.
Restructuring and property costs relate to our Save to Invest programme and rationalisation of property assets in the UK and Central Europe, including the fair value remeasurement of certain residential properties transferred to assets held for sale. The prior year included adjusting income relating to gains on disposal of surplus properties.
Adjusting items in net finance (costs) / income and tax are set out below. Adjusting items included within discontinued operations in the prior year primarily related to fair value remeasurement of assets of the disposal group, associated with the sale of our Banking operations to Barclays in November 2024.
Further detail on adjusting items can be found in Note 4, starting on page 23.
Net finance costs:
| On a continuing operations basis | H1 25/26 £m | H1 24/25 £m |
| Net interest costs | (67) | (77) |
| Net finance expenses from insurance contracts | (6) | (6) |
| Finance charges payable on lease liabilities | (190) | (186) |
| Adjusted net finance costs | (263) | (269) |
| Fair value remeasurements of financial instruments | (26) | 66 |
| Net pension finance costs | (8) | (15) |
| Adjusting items in net finance (costs) / income | (34) | 51 |
| Net finance costs | (297) | (218) |
Adjusted net finance costs of £263m are broadly flat year-on-year, reflecting the impact of refinancing partially offset by lower interest income. Within adjusting items, the £(26)m net cost for fair value remeasurements of financial instruments principally relates to the change in the fair value of index-linked swaps associated with certain rental payments. The cost reflects a decrease in long term UK inflation expectations since the start of the period. In the prior year, inflation expectations had increased, and hence the derivative fair value increased.
Net pension costs decreased by £7m, driven by a reduction in the opening position of the defined benefit pension plan deficit.
Further detail on finance income and costs can be found in Note 5 on page 24, as well as further detail on the adjusting items in Note 4, starting on page 23.
Group tax:
| On a continuing operations basis | H1 25/26£m | H1 24/25£m |
| Tax on adjusted profit | (379) | (368) |
| Tax on adjusting items | 24 | (2) |
| Tax on profit | (355) | (370) |
Tax on adjusted Group profit was £(379)m, slightly higher than last year reflecting an increase in adjusted Group profit, with the adjusted effective tax rate broadly flat at 26.9% (H1 24/25: 26.7%). The adjusted effective tax rate is higher than the UK statutory rate of 25%, primarily due to the depreciation of assets which do not qualify for tax relief. We continue to expect our adjusted effective tax rate to be around 27% in the current year.
The current year £24m adjusting credit in tax primarily relates to the tax effect of amortisation of acquired intangible assets, fair value remeasurements on derivative financial instruments and separation costs associated with the disposal last year of the Group’s Banking operations.
Earnings per share:
| On a continuing operations basis | H1 25/26 | H1 24/25 | YoY change |
| Adjusted diluted EPS | 15.43p | 14.45p | 6.8% |
| Statutory diluted EPS | 14.22p | 14.62p | (2.7)% |
| Statutory basic EPS | 14.38p | 14.76p | (2.6)% |
| On a total basis, including discontinued operations | |||
| Statutory diluted EPS | 14.22p | 15.03p | (5.4)% |
| Statutory basic EPS | 14.38p | 15.18p | (5.3)% |
Adjusted diluted EPS was 15.43p, 6.8% higher year-on-year, primarily driven by a reduction in the number of shares in issue from our ongoing share buyback programme and growth in adjusted operating profit.
Statutory diluted EPS was 14.22p, (2.7)% lower year-on-year, driven by adjusting items, including the impact of fair value remeasurements of certain financial instruments.
Dividend:
The interim dividend has been set at 4.80 pence per ordinary share, in line with our policy of setting the interim dividend at 35% of the prior full year dividend.
The interim dividend will be paid on 21 November 2025 to shareholders who are on the register of members at close of business on 10 October 2025 (the Record Date). Shareholders may elect to reinvest their dividend in the Dividend Reinvestment Plan (DRIP). The last date for receipt of DRIP elections and revocations will be 31 October 2025.
Summary of Net debt:
| Aug-25£m | Feb-25£m | Movement£m | |
| Net debt before lease liabilities | (2,093) | (1,738) | (355) |
| Lease liabilities | (7,791) | (7,716) | (75) |
| Net debt | (9,884) | (9,454) | (430) |
| Net debt / EBITDA | 2.0x | 2.0x |
Net debt was £(9,884)m, an increase of £(430)m from year end. The year end Net debt position included c.£700m from the sale of the Group’s Banking operations, ahead of returning the proceeds to shareholders. We generated free cash flow of £1,298m in the half, which was more than offset by cash outflows relating to total share buybacks of £(773)m and the payment of last year’s final dividend of £(627)m. Lease liabilities increased by £(75)m driven by rent reviews and new store openings.
We had strong levels of liquidity at the end of the first half, including £3.4bn of cash and highly liquid short-term deposits and money market investments. In addition, our £2.5bn committed revolving credit facility remained undrawn and is in place until at least the end of October 2027.
Our Net debt to EBITDA ratio was 2.0 times at the end of the first half, below our target range of 2.8 to 2.3 times.
Fixed charge cover was 4.3 times at the end of the first half versus 4.2 times at the end of FY 24/25.
Defined benefit pension schemes:
| Aug-25£m | Feb-25£m | Movement£m | |
| Defined benefit schemes in surplus | 68 | 56 | 12 |
| Defined benefit schemes in deficit | (231) | (307) | 76 |
| Deferred tax asset | 51 | 71 | (20) |
| Deficit in schemes at the end of the period (net of deferred tax) | (112) | (180) | 68 |
Net of tax, the net IAS 19 pension deficit has reduced from £(180)m to £(112)m, principally reflecting the impact of higher discount rates and updated demographic assumptions. The principal defined benefit pension plan within the Group is the Tesco PLC Pension Scheme (the Scheme), a UK scheme that has been closed to future accrual since 2015.
During H1, together with the Scheme trustee, we agreed the 31 March 2025 triennial funding valuation for the Scheme. This showed that the actuarial position of the Scheme for funding purposes was in surplus, with a funding level of 106% (versus 104% at 31 March 2022). As a result, it was agreed with the Scheme trustee that no pension deficit contributions would be required from the Group.
Further detail on post-employment benefits can be found in Note 17, starting on page 32.
Summary free cash flow:
The following table reconciles Group adjusted operating profit to free cash flow. Further details are included in Note 2, starting on page 21.
| On a continuing operations basis | H1 25/26 £m | H1 24/25 £m | Movement £m |
| Group adjusted operating profit | 1,674 | 1,649 | 25 |
| Less IMS adjusted operating profit | (100) | (94) | (6) |
| Retail adjusted operating profit | 1,574 | 1,555 | 19 |
| Add back: Depreciation and amortisation | 866 | 819 | 47 |
| Other reconciling items | 3 | 22 | (19) |
| Pensions | (17) | (14) | (3) |
| Decrease in working capital | 408 | 169 | 239 |
| Cash generated from operations before adjusting items | 2,834 | 2,551 | 283 |
| Cash capex | (716) | (594) | (122) |
| Net interest | (269) | (245) | (24) |
| – Interest related to Net debt before lease liabilities | (76) | (58) | (18) |
| – Interest related to lease liabilities | (193) | (187) | (6) |
| Tax paid | (226) | (176) | (50) |
| Dividends received | 52 | 2 | 50 |
| Repayment of capital element of obligations under leases | (314) | (294) | (20) |
| Own shares purchased for share schemes | (63) | 17 | (80) |
| Free cash flow | 1,298 | 1,261 | 37 |
| Memo (not included in free cash flow definition): | |||
| – Net acquisitions and disposals | (11) | (50) | 39 |
| – Property buybacks, store purchases and disposal proceeds | (11) | (14) | 3 |
| – Cash impact of adjusting items | (71) | (52) | (19) |
We delivered free cash flow of £1,298m, with cash generated from operations improving by £283m year-on-year driven by growth in operating profit and working capital inflows. Free cash flow was £37m higher than last year, with the increase in cash generated from operations partly offset by the earlier phasing of capital expenditure and own shares purchased for employee share schemes.
The working capital inflow of £408m largely reflects trade seasonality, with the year-on-year improvement driven by our strong sales performance (leading to higher trade balances) and a new c.£90m payable from the EPR levy, the majority of which will be settled in the second half.
Net interest paid was £(24)m higher year-on-year, principally due to the timing of bond coupons and associated derivatives, lower rates on cash deposits and higher lease interest.
Tax paid was £(50)m higher year-on-year, mainly driven by the end of historical tax deductions and phasing of tax payments.
Dividends received were £50m higher, reflecting dividends received from Insurance and Money Services in relation to the prior year.
Within the memo lines shown, the net £(11)m acquisitions and disposals outflow primarily relates to settlement of deferred consideration on Booker’s acquisition of Venus Wine and Spirit Merchants PLC. The £(11)m net outflow relating to property transactions relates to the buyback of three stores in the UK, net of the sale of a number of residential units above our stores. The cash impact of adjusting items of £(71)m relates to Save to Invest restructuring costs provided for at the end of the prior financial year, separation costs relating to the disposal of the Group’s Banking operations last year and a property transaction in the UK.
Capital expenditure and space:
| UK & ROI | Booker | Central Europe | Group | |||||
| H1 25/26 | H1 24/25 | H1 25/26 | H1 24/25 | H1 25/26 | H1 24/25 | H1 25/26 | H1 24/25 | |
| Capex | £607m | £477m | £23m | £20m | £37m | £33m | £667m | £530m |
| Openings (k sq ft) | 137 | 116 | – | – | 15 | 44 | 152 | 160 |
| Closures (k sq ft) | (8) | (35) | (12) | – | (6) | – | (26) | (35) |
| Repurposed (k sq ft) | – | – | – | – | (30) | (107) | (30) | (107) |
| Net space change (k sq ft) | 129 | 81 | (12) | – | (21) | (63) | 96 | 18 |
Space in the above table is defined as net space in store adjusted to exclude checkouts, space behind checkouts, customer service desks and customer toilets. The data above excludes space relating to franchise stores.
Capital expenditure shown in the table above reflects expenditure on ongoing business activities across the Group, excluding property buybacks, and other store purchases along with their associated refit costs.
Our capital expenditure in the first half was £667m, an increase of £137m compared with last year, reflecting a more even shape to this year’s investments. We expect total capital expenditure this year of c.£1.5bn. This includes the first phase of investment in our new distribution centre at DP World London Gateway. The site is expected to open in 2029 and will leverage the latest technology to enhance our supply chain and support future growth.
Statutory capital expenditure has seen an increase of £144m to £699m.
We continue to prioritise investments in high returning areas, including automation in parts of our distribution network and developing our digital platforms, in addition to continued investment to improve the customer experience in our store estate.
In the first half, we opened a total of 38 stores across the Group and refreshed a further 112 stores. In the UK, we opened one large store, 24 Tesco Express stores and seven One Stop stores and in ROI we opened two new large stores and one Tesco Express. In Central Europe, we opened two new large stores and one new convenience store.