Thor Energy PLC (LON:THR, ASX: THR, OTCQB: THORF) has reported on its activities for the Quarterly period from 1 April to 30 June 2026.
Andrew Hume, CEO and Managing Director, Thor Energy Plc, commented:
“The past quarter has strengthened our exploration model and confirmed our conviction that the HY-Range Project is a significant geological opportunity for us to explore further. We recorded natural hydrogen concentrations of up to 3% during our Phase-2 geochemistry survey, which surpassed our initial expectations. More importantly, the rigorous scientific methodology we applied to this programme gives us confidence that our acreage, our play-based exploration approaches, and our enthusiasm for this project have been warranted thus far.
“With these strong results increasing our confidence in the project, we are now taking the next critical step. Awarding a major 464 line-kilometre 2D seismic survey to Velseis will allow us to illuminate the subsurface geology of our highest-priority focus areas for the very first time, thereby linking our surface data to the deep basement rocks that generate the hydrogen.
“The strategic and successful divestment of our legacy non-core assets means this milestone seismic acquisition is fully funded by our existing cash reserves. We are moving rapidly toward defining our maiden drill targets and look forward to an exciting second half of the year as we drive the HY-Range project toward the drill bit.”
HY-RANGE PROJECT – SOUTH AUSTRALIAN NATURAL HYDROGEN AND HELIUM
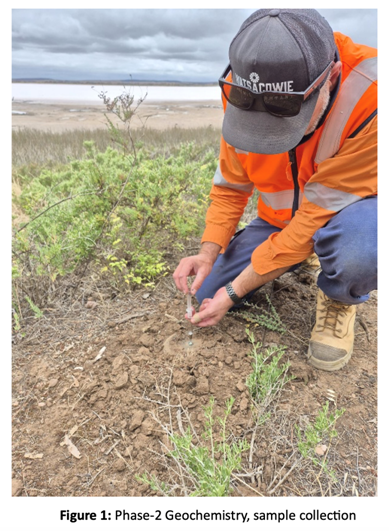
Phase-2 Soil Air Geochemistry Survey
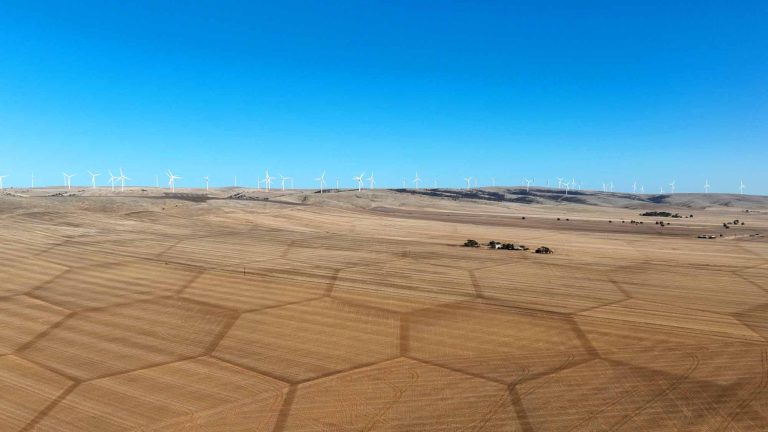
The Company announced the preliminary results of its Phase-2 soil air geochemistry survey at the HY-Range Project (RSEL 802) during the quarter, recording natural hydrogen readings of up to 3% (30,000ppm), approximately 60,000 times background levels, and validating three of the Company’s highest-priority exploration focus areas: Mallala, Lochiel and Crystal[1]. The survey builds on and materially exceeds Phase 1 results, with consistently repeated hydrogen anomalies ranging from several hundred to several thousand times background across the key target areas, significantly increasing confidence in the scale and continuity of the natural hydrogen system.
Evolved sampling techniques, in which depth, duration and material variables were tested alongside controls, strongly indicate the presence of highly active natural hydrogen generation and substantially reduce the risk of sampling error or anthropogenic (human-made) contamination. The anomalously high surface geochemistry aligns with the Company’s geological models and the crustal-scale basement architecture, faulting and focusing mechanisms considered necessary to deliver economic volumes of natural hydrogen. The Phase-2 results provide further validation of the Company’s exploration model and increase our confidence in the HY-Range Project ahead of the next phase of exploration.
Following these highly encouraging results, the Company began planning for a large-scale 2D seismic acquisition programme designed to image the subsurface geology, refine structural interpretations and identify priority drilling targets across the HY-Range Project. The programme marks the next critical step towards testing the project’s natural hydrogen potential through drilling.
2D Seismic Acquisition Contract
Following a comprehensive bid evaluation, the Company signed a Letter of Award with Velseis Pty Ltd, a leading Australian seismic contractor, for an onshore 2D seismic acquisition survey across RSEL 802[2]. The programme will acquire approximately 464 line-kilometres of 2D seismic data, targeting the Company’s highest-priority zones within the Torrens Hinge Zone, with acquisition expected between Q3 and Q4 2026.
The seismic data will be integrated with the Company’s existing subsurface models, gravity, magnetic and passive datasets, and with the Phase-2 geochemistry results, to provide depth control, reveal the nature of the hydrogen and helium-generating basement rocks, map faulting that acts as a migration control, and confirm and mature targets for definitive exploration drilling.
The programme is fully funded from existing cash reserves following the Company’s recent non-core asset divestments. The Company will move to a full contract in the coming weeks and will provide further timing updates to the market once all approvals and detailed planning are complete.
FINANCE AND CASH MOVEMENTS
Cash Movement:
Net cash outflows from Operating and Investing activities for the quarter of $501,000, which included outflows of $66,000 directly related to exploration activities. Thor ended the quarter with a cash balance of $2,815,000, reflecting continued disciplined management of the Company’s cash reserves following its recent portfolio divestments.
In addition to the current cash reserves of $2,815,000, the agreement announced on 16 September 2025, which outlined the Term Sheet to Sell FRAM Joint Venture of which Thor owned 75% to ASX-Listed Tivan Limited for A$8,750,000, stipulates that Thor is due to receive the first of three annual deferred completion payments of A$1,312,500 on 1 September 2026.
Cashflows for the quarter include payments of $138,500 to Directors, comprising the CEO-Managing Director’s salary and the Non-Executive Directors’ salaries/fees.
TENEMENT SCHEDULE
As of 30 June 2026, the consolidated entity holds an interest in the following Australian tenements:
| Project | Tenement | Area kms2 | Area ha. | Holders | Interest |
| HY-Range | RSEL 802 | 6332 | Go Exploration | 80.2% | |
| Geo-Range | GSEL 804 | 2368 | Go Exploration | 80.2% | |
| Geo-Range | GSEL 805 | 2389 | Go Exploration | 80.2% | |
| Geo-Range | GSEL 806 | 1558 | Go Exploration | 80.2% | |
| Project | Tenement | Area kms2 | Area ha. | Holders | Interest |
| Bonya | EL32167 | 74.54 | Molyhil Mining Pty Ltd | 40% | |
| Alford East | EL6529 | 315.1 | Hale Energy Pty Ltd | 80% oxide interest |
USA mineral exploration licence portfolio
As of 30 June 2026, the consolidated entity holds 25% interest in the uranium and vanadium projects in the US States of Colorado and Utah, as follows:
| Claim Group | Serial Number | Claim Name | Area | Holders | Interest |
| Vanadium King (Utah) | UMC445103 to UMC445202 | VK-001 to VK-100 | 100 blocks(2,066 acres) | Cisco Minerals Inc | 25% |
| Radium Mountain (Colorado) | CMC292259 to CMC292357 | Radium-001 to Radium-099 | 99 blocks(2,045 acres) | Standard Minerals Inc | 25% |
| Groundhog (Colorado) | CMC292159 to CMC292258 | Groundhog-001 to Groundhog-100 | 100 blocks(2,066 acres) | Standard Minerals Inc | 25% |
Appendix 5B
Mining exploration entity or oil and gas exploration entity
quarterly cash flow report
| Name of entity | ||
| THOR ENERGY PLC | ||
| ABN | Quarter ended (“current quarter”) | |
| 121 117 673 | 30 June 2026 | |
| Consolidated statement of cash flows | Current quarter $A’000 | Year to date (12 months) $A’000 | |
| 1. | Cash flows from operating activities | — | – |
| 1.1 | Receipts from customers | ||
| 1.2 | Payments for | ||
| (a) exploration & evaluation | (66) | (401) | |
| (b) development | – | – | |
| (c) production | – | – | |
| (d) staff costs | (193) | (886) | |
| (e) administration and corporate costs | (242) | (1,289) | |
| 1.3 | Dividends received (see note 3) | – | – |
| 1.4 | Interest received | – | – |
| 1.5 | Interest and other costs of finance paid | – | – |
| 1.6 | Income taxes paid | – | – |
| 1.7 | Government grants and tax incentives | – | – |
| 1.8 | Other | – | – |
| 1.9 | Net cash from / (used in) operating activities | (501) | (2,576) |
| 2. | Cash flows from investing activities | ||
| 2.1 | Payments to acquire or for: | – | – |
| (a) entities | – | – | |
| (b) tenements | 3,937 | ||
| (c) property, plant and equipment | – | – | |
| (d) exploration & evaluation | – | – | |
| (e) equity accounted investments | – | – | |
| (f) other non-current assets (bonds) | – | 52 | |
| 2.2 | Proceeds from the disposal of: | – | – |
| (a) entities | |||
| (b) tenements (bond refunds) | – | – | |
| (c) property, plant and equipment | – | – | |
| (d) investments | – | – | |
| (e) other non-current assets | – | – | |
| 2.3 | Cash flows from loans to other entities | – | – |
| 2.4 | Dividends received (see note 3) | – | – |
| 2.5 | Other (Government grants) | – | – |
| 2.6 | Net cash from / (used in) investing activities | – | 3,989 |
| 3. | Cash flows from financing activities | – | – |
| 3.1 | Proceeds from issues of equity securities (excluding convertible debt securities) | ||
| 3.2 | Proceeds from issue of convertible debt securities | – | – |
| 3.3 | Proceeds from exercise of options | – | |
| 3.4 | Transaction costs related to issues of equity securities or convertible debt securities | – | – |
| 3.5 | Proceeds from borrowings | – | – |
| 3.6 | Repayment of borrowings (lease liability) | – | – |
| 3.7 | Transaction costs related to loans and borrowings | – | – |
| 3.8 | Dividends paid | – | – |
| 3.9 | Other (funds received in advance of a placement) | – | – |
| 3.10 | Net cash from / (used in) financing activities | – | – |
| 4. | Net increase / (decrease) in cash and cash equivalents for the period | (501) | 1,413 |
| 4.1 | Cash and cash equivalents at beginning of period | 3,314 | 1,459 |
| 4.2 | Net cash from / (used in) operating activities (item 1.9 above) | (501) | (2,576) |
| 4.3 | Net cash from / (used in) investing activities (item 2.6 above) | – | 3,989 |
| 4.4 | Net cash from / (used in) financing activities (item 3.10 above) | – | – |
| 4.5 | Effect of movement in exchange rates on cash held | – | – |
| 4.6 | Cash and cash equivalents at end of period | 2,815 | 2,815 |
| 5. | Reconciliation of cash and cash equivalents at the end of the quarter (as shown in the consolidated statement of cash flows) to the related items in the accounts | Current quarter $A’000 | Previous quarter $A’000 |
| 5.1 | Bank balances | 2,815 | 3,314 |
| 5.2 | Call deposits | – | – |
| 5.3 | Bank overdrafts | – | – |
| 5.4 | Other (provide details) | – | – |
| 5.5 | Cash and cash equivalents at end of quarter (should equal item 4.6 above) | 2,815 | 3,314 |
| 6. | Payments to related parties of the entity and their associates | Current quarter $A’000 |
| 6.1 | Aggregate amount of payments to related parties and their associates included in item 1 | 138,500 |
| 6.2 | Aggregate amount of payments to related parties and their associates included in item 2 | – |
| Note: if any amounts are shown in items 6.1 or 6.2, your quarterly activity report must include a description of, and an explanation for, such payments. The amount at item 6.1 above represents fees paid to Non-Executive Directors, and remuneration paid to the Managing Director. | ||
| 7. | Financing facilities Note: the term “facility’ includes all forms of financing arrangements available to the entity.Add notes as necessary for an understanding of the sources of finance available to the entity. | Total facility amount at quarter end $A’000 | Amount drawn at quarter end $A’000 |
| 7.1 | Loan facilities | – | – |
| 7.2 | Credit standby arrangements | – | – |
| 7.3 | Other (please specify) | – | – |
| 7.4 | Total financing facilities | – | – |
| 7.5 | Unused financing facilities available at quarter end | – | |
| 7.6 | Include in the box below a description of each facility above, including the lender, interest rate, maturity date and whether it is secured or unsecured. If any additional financing facilities have been entered into or are proposed to be entered into after quarter end, include a note providing details of those facilities as well. | ||
| 8. | Estimated cash available for future operating activities | $A’000 |
| 8.1 | Net cash from / (used in) operating activities (item 1.9) | (501) |
| 8.2 | (Payments for exploration & evaluation classified as investing activities) (item 2.1(d)) | – |
| 8.3 | Total relevant outgoings (item 8.1 + item 8.2) | (501) |
| 8.4 | Cash and cash equivalents at quarter end (item 4.6) | 2,815 |
| 8.5 | Unused finance facilities available at quarter end (item 7.5) | – |
| 8.6 | Total available funding (item 8.4 + item 8.5) | 2,815 |
| 8.7 | Estimated quarters of funding available (item 8.6 divided by item 8.3) | 5.6 |
| Note: if the entity has reported positive relevant outgoings (ie a net cash inflow) in item 8.3, answer item 8.7 as “N/A”. Otherwise, a figure for the estimated quarters of funding available must be included in item 8.7. | ||
| 8.8 | If item 8.7 is less than 2 quarters, please provide answers to the following questions: | |
| 8.8.1 Does the entity expect that it will continue to have the current level of net operating cash flows for the time being and, if not, why not? | ||
| Answer: N/A | ||
| 8.8.2 Has the entity taken any steps, or does it propose to take any steps, to raise further cash to fund its operations and, if so, what are those steps and how likely does it believe that they will be successful? | ||
| Answer: N/A | ||
| 8.8.3 Does the entity expect to be able to continue its operations and to meet its business objectives and, if so, on what basis? | ||
| Answer: Yes | ||
| Note: where item 8.7 is less than 2 quarters, all of questions 8.8.1, 8.8.2 and 8.8.3 above must be answered. | ||
Notes
1. This quarterly cash flow report and the accompanying activity report provide a basis for informing the market about the entity’s activities for the past quarter, how they have been financed and the effect this has had on its cash position. An entity that wishes to disclose additional information over and above the minimum required under the Listing Rules is encouraged to do so.
2. If this quarterly cash flow report has been prepared in accordance with Australian Accounting Standards, the definitions in, and provisions of, AASB 6: Exploration for and Evaluation of Mineral Resources and AASB 107: Statement of Cash Flows apply to this report. If this quarterly cash flow report has been prepared in accordance with other accounting standards agreed by ASX pursuant to Listing Rule 19.11A, the corresponding equivalent standards apply to this report.
3. Dividends received may be classified either as cash flows from operating activities or cash flows from investing activities, depending on the accounting policy of the entity.
4. If this report has been authorised for release to the market by your board of directors, you can insert here: “By the board”. If it has been authorised for release to the market by a committee of your board of directors, you can insert here: “By the [name of board committee – eg Audit and Risk Committee]”. If it has been authorised for release to the market by a disclosure committee, you can insert here: “By the Disclosure Committee”.
5. If this report has been authorised for release to the market by your board of directors and you wish to hold yourself out as complying with recommendation 4.2 of the ASX Corporate Governance Council’s Corporate Governance Principles and Recommendations, the board should have received a declaration from its CEO and CFO that, in their opinion, the financial records of the entity have been properly maintained, that this report complies with the appropriate accounting standards and gives a true and fair view of the cash flows of the entity, and that their opinion has been formed on the basis of a sound system of risk management and internal control which is operating effectively.
[1] Refer to THR announcement dated 9 June 2026
[2] Refer to THR announcement dated 24 June 2026