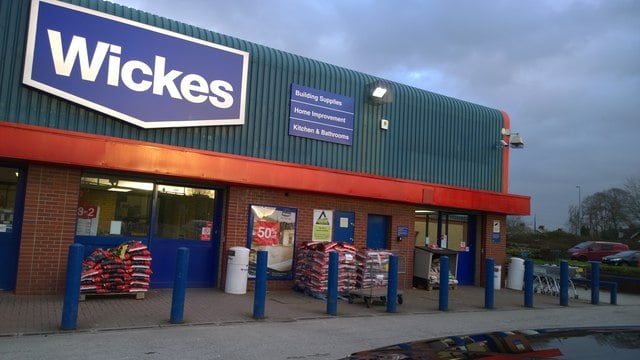
Wickes Group Plc (LON:WIX) has announced its Interim Results 2026 for the 26 weeks to 27 June 2026
Strong volume-led performance
On track to meet market forecasts for 2026 adjusted PBT
Financial Summary
| • | Total revenue of £865.3m (H1 2025: £847.9m) +2.1% year-on-year |
| • | Increasing volume growth in Retail1 driving revenue +0.8% despite 2.4% deflation; a strong order book in Design & Installation2 driving 5.7% revenue growth |
| • | Adjusted profit before tax3 +1.1% year-on-year to £27.6m (H1 2025: £27.3m) with productivity actions partially mitigating cost inflation |
| • | Statutory profit before tax of £24.6m (H1 2025: £24.2m) |
| • | Net cash position of £151.6m (H1 2025 £158.0m) after growth investments and £26.3m returned to shareholders plus an additional £9.2m of net funding for EBT share purchases |
| • | Interim dividend declared +2.8% year-on-year to 3.7p (H1 2025: 3.6p) |
Strategic Highlights
| • | TradePro sales growth of 5%, driven by an increase in active members4 to 671,000 (H1 2025: 615,000) |
| • | Continued Retail market share5 growth YoY with particular gains in decorative, gardening and timber |
| • | Fifth consecutive quarter of delivered sales growth6 in Design & Installation, driven by project volumes |
| • | Property strategy progressing well, with eight refits/refreshes in the period. Pipeline of new stores building, with 4-5 openings in H2, as we progress our ambition to reach 300 stores |
| • | Digital investments continue to underpin growth and productivity with further benefits expected in H2 |
| • | Campaign to tackle tool theft and pledge to offer free marking for over a quarter of a million power tools, reinforcing our position as a trusted partner for tradespeople, our most strategically valuable customers |
Current Trading & Outlook
As anticipated, trading in Q3 so far has shown a significantly improved trend, with a step up in Retail to mid-single-digit LFL revenue growth.
Our value-led and differentiated business model leaves us well-positioned to continue outperforming the market. We have a good productivity plan in place which will support our profitability in H2 and, as previously noted, we will also benefit from lower business rates this year. Whilst the consumer environment remains uncertain, we are on track to meet consensus expectations8 of c. 10% growth in adjusted PBT for 2026.
Our Q3 trading update will be released in late October.
David Wood, Chief Executive of Wickes, commented:
“This has been another period of strong volume-led performance for Wickes, as more customers choose to shop with us. Our value-led retail proposition continues to appeal to both DIY and Trade customers, with TradePro achieving record levels of active members. Design & Installation delivered sales remain in growth, with particularly strong sales of Wickes Bespoke Bathrooms and Lifestyle Kitchens, demonstrating the appeal of our broader offer.”
“Our growth momentum through the first half has continued building into Q3, with a significant step-up to mid-single-digit LFL revenue growth in Retail”.
“Looking ahead, our digital investments are improving the customer experience and operational efficiencies and we remain confident in our strategy, continuing to invest for growth, including our ambition to reach 300 stores, to drive sustainable long-term value for shareholders.”
Summary of interim financial results
| £m | 26 weeks to 27 June 2026 | 26 weeks to28 June 2025 | Change |
| Statutory revenue Retail Design & Installation Ranges | 865.3 639.8 225.5 | 847.9634.4213.4 | 2.1%0.8%5.7% |
| Statutory gross profit Gross profit margin | 319.336.9% | 308.836.4% | 3.4%+0.5ppts |
| Statutory operating profit Operating profit margin | 37.44.3% | 37.04.4% | 1.1%-0.0ppts |
| Statutory profit before tax | 24.6 | 24.2 | 1.7% |
| Adjusted3 gross profit Adjusted gross profit margin | 317.836.7% | 312.036.8% | 1.9%-0.1ppts |
| Adjusted3 operating profit Adjusted operating profit margin | 40.84.7% | 40.14.7% | 1.7%-0.0ppts |
| Adjusted3 profit before tax Adjusted PBT margin | 27.63.2% | 27.33.2% | 1.1%-0.0ppts |
| Basic earnings per share | 8.6p | 9.0p | (4.4)% |
| Adjusted3 basic earnings per share | 9.6p | 10.0p | (4.0)% |
| Interim dividend | 3.7p | 3.6p | 2.8% |
Earnings per share in the period were lower year-on-year due to a lower effective tax rate in H1 2025, principally due to revising estimates related to capital allowance claims on historical capital expenditure and prior year adjustments.