
City Natural Resources Growth and Income PLC (LON:CYN) has announced its Fact Sheet as at 31 October 2026
Monthly Investor Report – City Natural Resources Growth and Income PLC – October 2026
Portfolio Managers
Keith Watson and Robert Crayfourd
Description
The Company aims to generate capital growth and income, predominantly from a portfolio of mining and resource equities, and from mining, resource and industrial fixed interest securities.
Key Advantages for the Investor
Access to under-researched, mid and smaller-cap companies in the Natural Resources sector
Actively managed across commodity weights through the cycle
Dividend policy targeting distributions of 8% of NAV per annum, paid quarterly; not guaranteed
Ordinary Share and NAV Performance (cumulative total return)[1]
| NAV | (6.6) | 6.1 | (11.3) | 28.8 | 111.3 | 133.2 | 1384.1 |
| Share Price | (9.2) | 6.1 | (3.9) | 37.2 | 159.9 | 179.1 | 1599.7 |
| MSCI World Energy Index1 | 11.8 | 16.2 | 17.0 | 56.0 | 67.6 | 178.4 | 924.2 |
| MSCI World Metals & Mining Index1 | (8.7) | (0.7) | (4.3) | 24.2 | 71.1 | 108.1 | 832.9 |
Past performance is not a reliable indicator of future results.
Commentary[2]
October was an energy-led month. US investors appear to expect a swift resolution to the conflict involving Iran, a view we question. October saw the highest number of attacks on shipping in and around the Strait of Hormuz since tracking began in 2017 (Washington Institute for Near East Policy). Houthi forces continued to strike Saudi infrastructure, and reports suggested the US and Israel could consider renewed military action after the US mid-term elections. Brent rose c.14% to $117/bbl. Refining margins eased slightly but remain extremely high, with refined products priced close to $200/bbl, sustaining inflationary pressure. Continued Ukrainian attacks on Russian refineries are keeping refining capacity tight. European gas prices rose 43% to their highest level since late 2022. EU storage stood at around 75%, a record low for the time of year, with Qatari LNG under force majeure and outages at Norwegian fields. US natural gas slipped c.2%, as limited export capacity leaves surplus gas trapped in the domestic market. Shipping rates remained exceptional, supporting holdings Frontline and BW LPG.
Energy holdings performed well, with Suncor, Spartan Delta, Tamarack Valley and Frontline rising 8-14%. These gains were more than offset by precious metals, however, as higher oil prices lifted interest-rate expectations and weighed on sentiment. Gold fell c.7% and silver c.19% in US dollars, and the GDXJ junior gold miners ETF fell 9% in sterling. Ora Banda fell c.16% after a weaker-than-expected September quarter, as mill downtime and wet weather hit production, alongside heavy spending on its new Waihi underground mine. We believe higher rates will raise questions over government debt affordability and prove a positive driver for precious metals. This is a key reason for our significant precious metals weighting.
Coal and uranium saw little pull-through from higher crude and gas prices. Thermal coal benchmarks rose c.2%, though coal producer Thungela rose 16%. The uranium spot price rose by a similar amount to the coal benchmarks, closing above $91/lb, and the long-term contract price, used in utilities’ multi-year agreements, reached a new high of c.$99/lb. Uranium equities nonetheless continued to lag the commodity, with NexGen down c.4% and Paladin c.15% alongside weakness in AI-related stocks. We believe nuclear is part of the energy solution for AI, and that this softness reflects technical factors rather than fundamentals.
Copper edged up c.2%, supported by supply risk in Chile: a strike at Centinela was resolved mid-month, and a threatened strike at Escondida was averted. We remain cautious for two reasons. The stalled US Section 232 decision on refined copper tariffs has deflated the COMEX premium. AI-led investment in copper miners also looks out of proportion to data centres’ small share of global copper demand. Global growth forecasts remain resilient, but rising energy costs and interest rates could weigh on emerging-market demand, so we keep our copper weighting low.
Since month end, the Democrats have won control of both chambers of Congress. At the time of writing, precious metal miners have rebounded, while copper miners and oil have weakened on expectations of a softer US stance on Iran. We do not expect this to prompt a significant change in our commodity allocation.
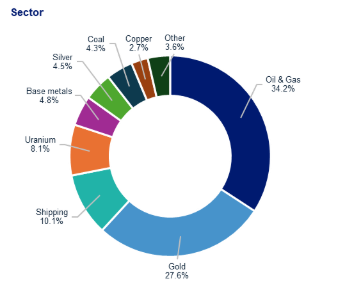
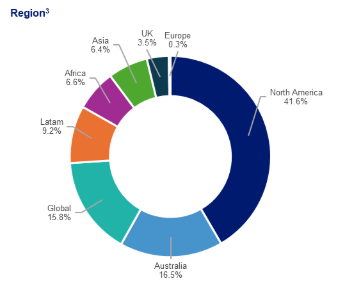
Portfolio Analysis (% of total investments market value)[3],[4]
 |  |
Top 20 Holdings (% of total investments market value)[5],[6]
| SPARTAN DELTA | 4.9% | CORE NATURAL RESOURCES | 2.7% | ||
| TAMBORAN RESOURCES | 4.6% | ORA BANDA MINING | 2.6% | ||
| NEXGEN ENERGY | 4.4% | GREATLAND RESOURCES | 2.6% | ||
| BW LPG | 4.3% | SUNCOR ENERGY | 2.6% | ||
| EMERALD RESOURCES | 3.9% | TEEKAY TANKERS | 2.5% | ||
| TAMARACK VALLEY ENERGY | 3.8% | HARBOUR ENERGY | 2.2% | ||
| PDI GOLD | 3.4% | G MINING VENTURE CORP | 2.2% | ||
| FRONTLINE | 3.2% | SOUTHERN CROSS GOLD | 2.1% | ||
| TRANSOCEAN | 3.2% | WEST AFRICAN RESOURCES | 2.0% | ||
| TALON METALS | 2.9% | METALS X | 1.9% | ||
| Top 10 Holdings Represent | 38.6% | Top 20 Holdings Represent | 62.0% |
AIFMD Leverage Limits (% of NAV)
| [7] | ||
| City Natural Resources Growth and Income PLC | 102 | 109 |
[1] The Company has no formal benchmark; the MSCI indices are shown for comparison only. Source: MSCI. Total return, sterling adjusted.
[2] All market data sourced from Bloomberg unless otherwise stated. All returns quoted in local currency unless otherwise stated. The Company may since have exited some or all of the positions detailed in the commentary.
[3] Tufton Investment Management Ltd as at the last business day of the month indicated at the top of this investor report.
[4] Percentages are of total investments (the market value of the portfolio, excluding cash) as at 31 October 2026. All holdings data are rounded to one decimal place. Totals may therefore differ from sum of constituents.
3 Region reflects the location of a company’s principal operations. Earlier months used a different classification and are not directly comparable
[5] Tufton Investment Management Ltd as at the last business day of the month indicated at the top of this investor report.
[6] Percentages are of total investments (the market value of the portfolio, excluding cash) as at 31 October 2026. All holdings data are rounded to one decimal place. Totals may therefore differ from sum of constituents.
[7] Tufton Investment Management Ltd as at the last business day of the month indicated at the top of this investor report. For methodology details see Article 4(3) of Directive 2011/61/EU (AIFMD) and Articles 6, 7, 9 and 10 of Delegated Regulation 231/2013.